Transform data to information with powerful Data Visualization Tools
Overview
Data visualization helps in simplifying complex quantitative information into easily accessible representations such as graphs and charts. Using Data Visualization, data from any data source, corporate data warehouse, Microsoft Excel, or web-based data can be transformed into more user-friendly, interactive visualizations in a matter of seconds.
Data visualization is the final leg of the data journey where we aggregate data via scraping or ETL, annotate, build a cognitive intelligence layer, and enable tangible evidence via data visualization. The data visualization can be accomplished using open source frameworks or commercial platforms and we help you in picking the right tools based on use case fitment.
Service Offering
Analyzing and transforming large volume of data into multidimensional charts and graphs using modern technology stacks and business intelligence.
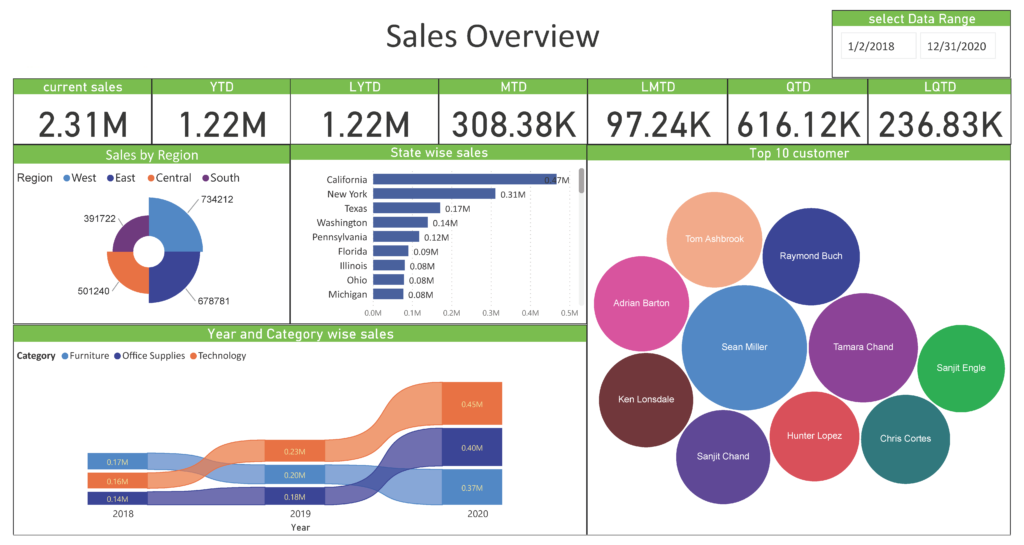
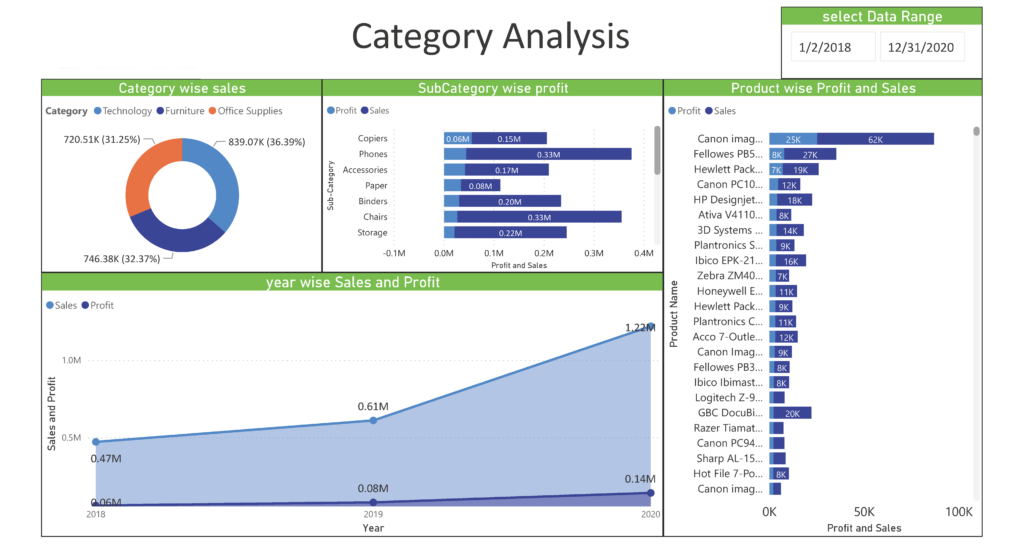
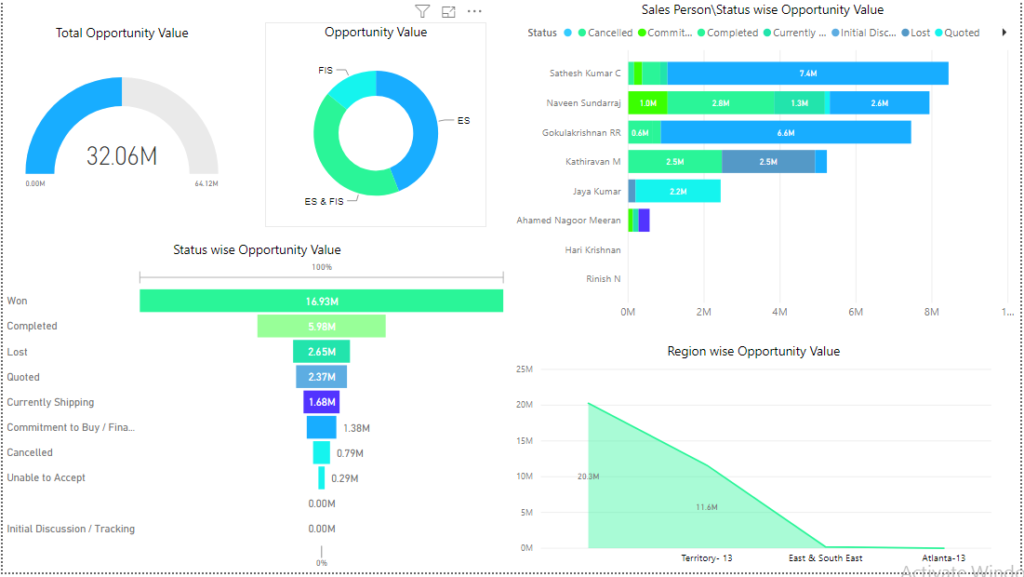
Interactive reports and KPI dashboards
Data visualization has become an integral part of any application development providing Interactive reporting and KPI Dashboards.
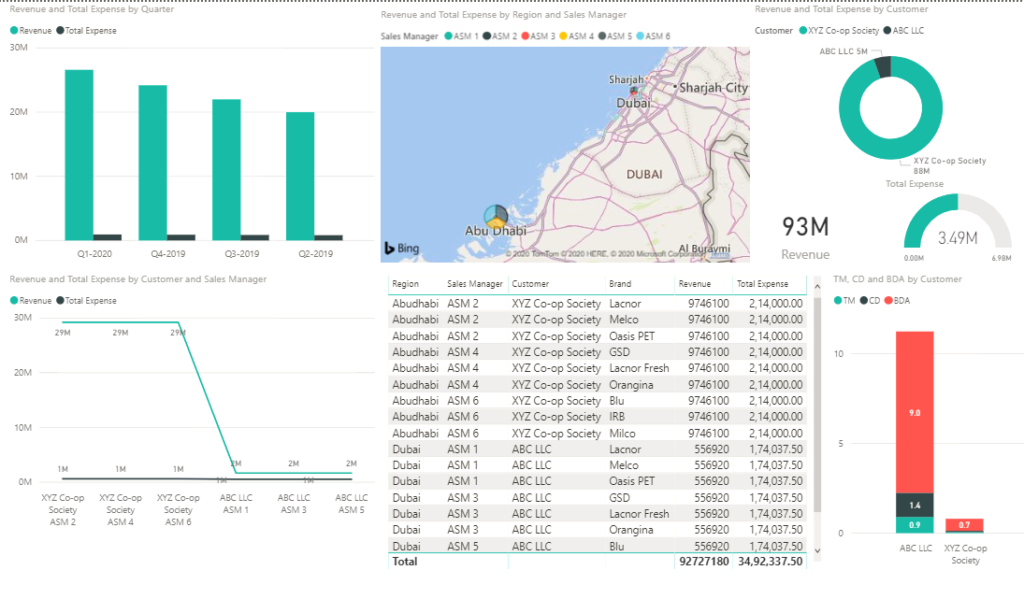
Omni- Channel Marketing Analytics
Collate large sales data into visually represented data to provide insights and marketing performance across all delivery channels.
Data Visualization Engineers
We provide data visualization engineers with expertise in Plotly, HiCharts, D3js, and MS PowerBI. We offer resources to consult on your visualization strategy and implementation.
Why Data Visualization?
Analyze
Easily analyzes and helps to determines the type of data you have and the information needs outlined using accurate and precise visualized representation.
Communicate
Visual data insights gives a clear cut understanding of complex datasets, identify relation and correlating trends by precisely pinpointing the most relevant information.
Explore
The visual data help in providing a way of exploring the hidden relationships, patterns and facts quickly and efficiently.
Our Technology Expertise
We use different tools such as Microsoft Power BI and Software libraries such as Plotly, D3js, Highcharts to provide interactive visual service.